Graphing Test Cases

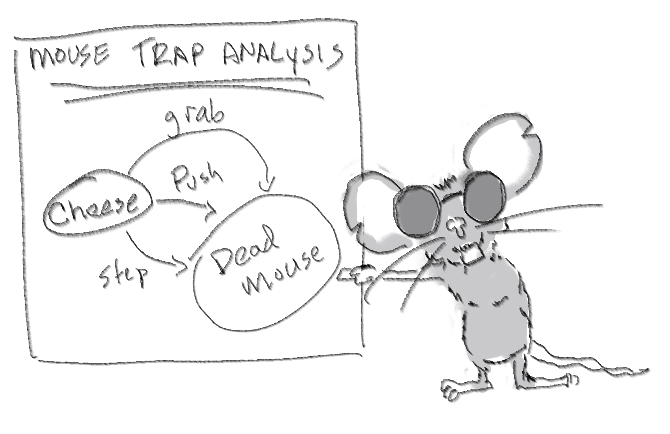
The above cartoon is my own. The AI generator was having trouble dealing with mice analyzing a Markov Chain, so I drew it myself.
Getting it all in an eyeful
One of the rules of thumb I like to use for creating test ideas and test cases is to “Get them all in an eyeful.” It is easier to understand the test idea, critique it, imagine problems from it, if the entire set of tests for a single idea, all the cases, can be observed in a single glance without having to flip pages, scroll the screen, or even move the eyes. Ideally you can describe dozens, hundreds, sometimes thousands of test cases with a very simple visual image in a way where the reader can still imagine easily what all those cases would be.
Say hello to our friend the graph
A graph is a series of vertices and edges connecting the vertices together. We frequently draw graphs using ovals and lines, although you can draw them any way you wish. The point is to be easy to create and understand.
One way we use graphs is to show sequences of actions. For example, the following
graph describes turning a computer on:

This might be more interesting if we imagine a computer that automatically
goes into low power standby mode when left alone:

Test cases and graphs
Sometimes we write test cases as lists. We might write a set of test cases for our computer in standby mode that look like this:
powering on
- start with power off
- press “power”
- check power comes on
power off after power on
- start with power off
- press “power”
- wait for power to come on
- press “power”
- confirm power turns off
machine transitions to standby
- start with power on
- do not interact with computer for longer than timeout
- confirm computer transitions to standby mode
We could keep this up for coming out of standby, repeating loops through standby and out, starting with power off and going all the way to standby and back down to powered off, the same sequences with loops on standby and back. We would have a long, tiresome list to look at. Compare that to this which describes many tests in a very short span of text:
Power state and standby transition tests:
Cover all state transitions in the following graph, all path traversal combinations, including those that execute loops for a maximum of three repeats. Add to that standby loops of 100 cycles before going back down to power off and confirm functionality with another cycle to power off and on.
The reader can see quickly that you are covering the different ways the computer can transition between power off, power on, and standby. They can suggest other ways of transitioning (e.g. what if someone holds down the power button while in standby?), they can suggest ways of checking state you might not have considered (in my example what to check in each state is not described, which may be a concern if there are non-obvious things to consider).
Looking at a larger example from the past
At one point I was a test lead for Microsoft SharePoint, and my testers owned the document library features. Document libraries supported the following set of actions:
- save/modify/delete - for either a new file or existing file
- checkout - an author is given exclusive access to change a file
- checkin - an author is creating a new version of a file and releasing access so others may edit
- publish - an author is submitting the file so that non-authors may see it
- approve - a group of reviewers mark a submitted for publishing as ready for readers to see
- reject - reviewers are saying the file is not allowed to be reviewed
- undo - whatever previous action is reversed and the file reverts to prior state
- revert - current version of the file is removed and the file goes back to a prior version
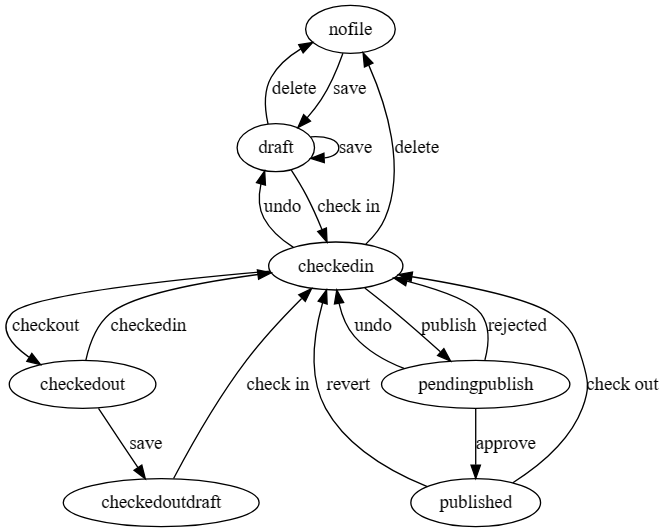
The following graph describes the relationship between these actions and document state:
Document Publish Workflow Transitions
_take note that the example has a name. Remember the power of naming things.
Notice how easy it is to imagine the size of the functionality described in the image. There are some details that are abbreviated that the reader has to infer. For every checkin a new version of the document is created and drafts from in between are removed. For every revert the version number of the document changes back to prior and a file is removed. Those can be explained in text to keep the image visually smaller.
Even without a fully expanded graph, we can see there are thousands of possible cases that derive from the image. What I like to do is then describe the traversals I intend to cover. For example:
Traversal to each node in the graph starting from no file and covering every edge leading to it. Add cases to cover each cycle at least three times. Add cases to cover compounded cycles at least three times.
You can cover more details if you need. Checking specific states is helpful. So is how to set preconditions. Anything that you might need to remember for reference, or that a person helping you critique and reveiw the test cases would be worth writing down.
The important point is how so many test ideas are described in such a compact format. We can spend our time thinking, creating, and imagining possible tests or threats and risks and less time typing information in long, tedious form.
Did I mention naming things?
I made a reference to another article where I describe how to refer to test ideas by names as a way of rapidly describing and creating new test cases. The same idea applies to our graph.
In the diagram above, the graph was named “Document Publish Workflow Transitions”. SharePoint had a lot of features, states, problems we wanted to test against those same features. One such example was user roles. Each user role had a different set of capabilities/limits on what they could do with a document. To describe such tests, we can name the user roles, and then describe how those combine with the document workflow tests. For example:
User Roles
- Author
- Reviewer
- Site Owner
Site Reader/Guest
For each of the roles in User Roles, execute each of the state transitions described in “Document Publish Workflow Transitions”. Cycles and full path traversals are a low risk concern and may be skipped.
Naming the test ideas and combining them allows a rapid construction of many new cases. Note that the description continues the pattern if describing how to make the combination, which combinations to eliminate, with a justification for why. The end result is a set of test cases that covers a lot of ground, but remains easy to imagine and review.
Making the Graphs
You can make the graphs using any means you want. Draw them on paper, or on a whiteboard. You could use Legos or wooden blocks. There are several tools for drawing graphs.
One of my favorite tools is GraphViz. It creates graphs without you having to do any of the drawing yourself. You describe the nodes and edges in a language called DOT. The publish diagram I used in this article was created with the following DOT script:
digraph G {
nofile->draft [label="save"]
draft->draft [label="save"]
draft->nofile [label="delete"]
draft->checkedin [label="check in"]
checkedin->draft [label="undo"]
checkedin->nofile [label="delete"]
checkedin->checkedout [label="checkout"]
checkedout->checkedin [label="checkedin"]
checkedout->checkedoutdraft [label="save"]
checkedoutdraft->checkedin [label="check in"]
checkedin->pendingpublish [label="publish"]
pendingpublish->checkedin [label="rejected"]
pendingpublish->checkedin [label="undo"]
pendingpublish->published [label="approve"]
published->checkedin [label="check out"]
published->checkedin [label="revert"]
}
You can download GraphViz from various places on the web, but I have found this online DOT compiler particularly useful
More Ideas for Easier Test Planning
I describe this idea, and more, in my book

