Ai And The Blanket Problem
Adding data to ML and AI training sets is like yanking on a blanket
One of the problems we have with AI is a problem handling what people like to call “edge conditions.” For sake of this discussion let’s just say “edge condition” means “something the appolication didn’t handle.” The most common answer to something the AI doesn’t handle is to add more data, or add better data. That frequently works well, but it doesn’t always fix the problem. Sometimes, the problem isn’t really fixable without entirely changing the AI model.
I like to think of it like blankets.
Who stole the blanket?
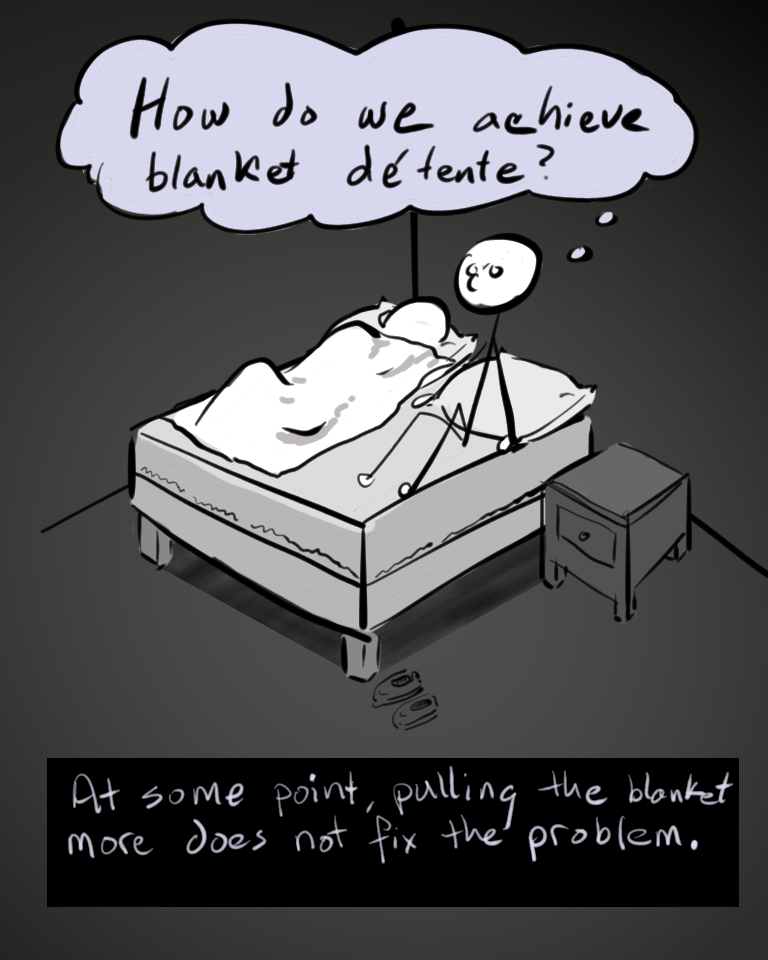
I suspect the blanket gag is as old as humans using blankets. It is a simple premise. Two (or more) people are covered up, sleeping, trying to use the same blanket. One of them turns, stretches, rolls over, adjusts the bedding, gets up and returns… and in the act of all their moving around has uncovered the other person. The visual gag is usually: turn, yank, cold.
There is another version of the gag where the blanket is just not big enough to cover everybody at once. Somebody gets shorted on coverage, and is either half-covered, half-not all night long, or is lying as still as possible right on the edge of being uncovered, the slightest move leaving them out in the cold.
The whole point of the gag is that so long as you are using that same blanket for that same group of people, there is no stable configuration where all of them can be covered at the same time. Slight adjustments to one person’s position, or to the arrangement of the blankets will uncover somebody who had been previously covered.
The only way you can address more configurations and state changes for the same number of people is with more blankets, or different blankets.
In this analogy, ML and AI training data is the pulling and moving and re-arranging of the blanket to try to fit it to the usage. Every tug and twist and yank and smoothing and pulling represents new data changing the arrangement of the blanket. The blanket is the underlying mathematics consuming the data. It is the same set of mathematical formulas producing a different arrangement of outcomes based on the data it is given. The formula is capable of producing many shapes, but there is a boundary on those shapes that has a limit.
There is an optimum shape of the blanket, the outcomes, that fits the desired response as best it can, but the formula can only cover so far before it reaches its limit. At some point, as you feed it data in hopes of yanking the response in a desired direction, you hit some mathematical limit that will drop other desired outcomes from the model.
Pulling the mathematical blanket ============================================ The blanket in our analogy is contorting and pulling across three dimension. It could lie flat (two dimensions) or roll up in a pile (three dimensions), but generally we think of the covered surface as two dimensional.
The mathematical blanket in a typical ML or AI model has far more than three dimensions. The data features that train a model usually make up a single dimension, as do combinations of those features, or calculated relationships between them. The square footage of a home might be one feature, its lot size another, number of bedrooms a third, whether it is on waterfront, number of bathrooms, proximity to transit, and on and on. For text, words and tokens are their own features, as well as frequency and distance relationships to each other, resulting in a matrix of billions of features in the larger LLM models. This set of features are like the fabric of the blanket, and the relationship they have to each other fed into the mathematical formula derives the possible shapes of the blanket, and most importantly, the limits of the space it can cover.
How well it covers the space is described by a single number, the error distance. When we do supervised learning, the answer from the AI model is compared against the correct answer from the training data, and the degree to which it is wrong is calculated across the whole set. The model is adjusted until it produces an answer with the lowest error value it can achieve.
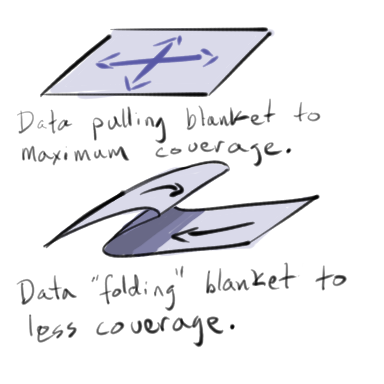
This always leaves some incorrect responses. Somewhere inside the model, the weights and relationships are set in some way that produces an incorrect prediction based on the input data. Sometimes we can correct this using the same model (the same set of features fed into the same mathematical formula) and have no problems. Think of this like a blanket that is balled up or folded over and just needs to be smoothed to cover more surface.
Other times, the blanket is already smoothed. Its coverage potential is maximized as far as it can possibly go, and any yanking or adjusting is going to uncover something that is currently covered.
It’s all in the percentages.. and that is both the good and the horrible =============================================== One of the common retorts to complaints about failure of AI and ML models to cover certain edge cases is to point out that the model demonstrates better overall percentage coverage than other solutions. This is the sort of defense offered up by self-driving car manufacturers when they say that refusal to use their technology is killing people. What they mean is “killing LESS people”, because their technology does kill people. But so does the alternative technology. The argument is that we should desire the alternative that kills fewer.
Whether or not we can believe the self-reported numbers of a manufacturer is a question for a different discussion. Right now, in our blanket analogy, it is more opportune for us to talk about the non-subtle and complicated world of percentages.
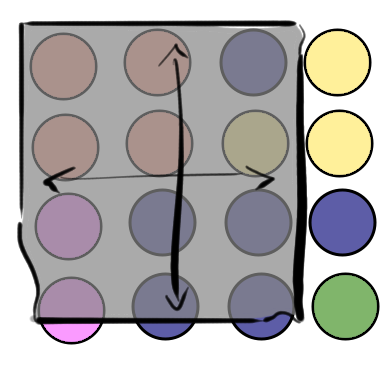
Let’s look again at the earlier illustration of a blanket covering a set of colored circles.
In this diagram, there are 16 circles, 12 of which are covered (mostly) by the blanket. That means the blanket is giving us 75% coverage of the total population. That seems pretty good. When we look at the population by color, we get the following breakdown:
| Color | Count | Covered | Percentage |
|---|---|---|---|
| Orange | 4 | 4 | 100% |
| Blue | 6 | 5 | 83% |
| Yellow | 3 | 1 | 33% |
| Pink | 2 | 2 | 100% |
| Green | 1 | 0 | 0% |
Two of the sub populations, Yellow and Green fall far below 75% at 33% and 0% each. Meanwhile, both the Orange and Pink populations are enjoying 100% coverage, and the largest group, Blue, is doing better than the average at 83%.
Our percentage problem is no longer simple. Pretend this represents a critical outcome where something non-covered represents lethality , injury, or financial harm. For a sub population, perhaps people of certain ethnic groups, economic populations, occupations, geographical distribution, religious affiliation, the 75% percentage coverage of the entire population is meaningless if their population is at 33%, particularly if in a prior solution they were higher (perhaps 50%?).
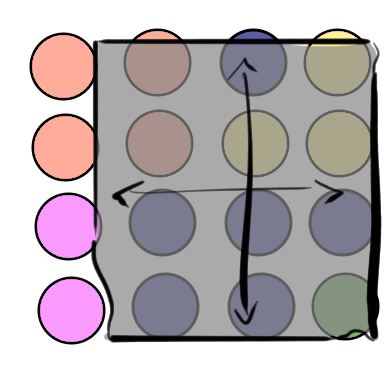
What happens if we try to fix the low coverage numbers for Yellow and Green? We can shift the blanket over to get both of them to 100% coverage. When we do that, Orange drops to 50%, the majority population Blue gets 100%, and Pink drops to 0% coverage.
| Color | Count | Covered | Percentage |
|---|---|---|---|
| Orange | 4 | 2 | 50% |
| Blue | 6 | 6 | 83% |
| Yellow | 3 | 3 | 100% |
| Pink | 2 | 0 | 0% |
| Green | 1 | 1 | 100% |
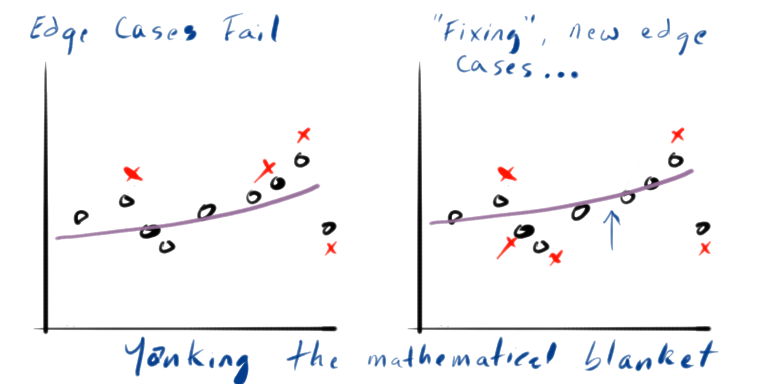
The problem with trying to adjust a model that is already at its limits is that no amount of feeding it more data is going to get it to improve its error function. All that is going to happen is the error function is going to keep the same optimized value, and shift which parts of the sample function it covers. This is a problem when the sub populations in the sample data are of different sizes and proportions, because the percentage of improvement at the overall level can become far worse at the sub population just by shifting the error around.
What do we do?
I run the risk of overusing my metaphor, but let’s treat this like we were talking about beds and blankets. The answers in that case are not that difficult:
- Ricky and Lucy Ricardo solution: Two beds. Even though the show was called “I Love Lucy” the two of them slept in separate beds (making the introduction of Little Ricky a few seasons later somewhat improbable).
- You’re Gonna Need a Bigger Boat: …or blanket. The Jaws reference is just funnier.
- Why do we only have one blanket?: Domestically, this is my personal preference. A mountain of blankets, sufficient for each person to roll around and tangle up as much as they will and never disturb the other person.
Any of those solutions is comparable to changing the model, the method, the algorithm. There are a lot of ways that ML and AI models are changed.
One of the most common changes is to change the feature data. Some features can be combined, new features can be added, relationships between features can be created. It is very common that the real problem is there is some ASPECT of the data that is missing, and maybe that aspect makes what was previously mysterious errors clear and obvious.
Another common change is to use different different kinds of models, or models in combination with each other. Maybe the models are combined with traditional, explicit programming that make the decision as part of an ensemble.
My point is not to recommend any specific set of guidelines for picking the right solution to a problem. My point is to illustrate the dynamics of situations where quite possibly the model you have chosen is never going to satisfy your needs sufficiently. Sometimes the model is failing to cover enough cases because it never can. Sometimes you have to change the solution itself.
As makers and testes of AI systems, what does this tell us?
I believe this tells us that for any of us working with AI systems, we need to understand the implications of mathematics and statistics on the behavior of those systems, and that they do reach limits on their capabilities that are bound by the math. We need to understand how those limits affect the overall system and the users of that system, because if we don’t understand it well we might find ourselves shipping a solution that is not only broken, but maybe cannot be fixed without an entirely different system.